After briefly mentioning API’s in our previous Doejo Dev sessions blog post on the value and functionality of JavaScript, we decided to explain how we have used API’s in our projects. This post will focus on the Google Maps API, highlighting how we used it to create the Map of the Dead, a zombie apocalypse survival map that went super viral.
Before we dive in to the customizable details of the Google Maps API, lets begin by simply explaining what an API is: Application Programing Interfaces pull, push and manipulate data from popular web services. These API’s let developers seamlessly integrate outside content, transferring it directly to the page.
The Google Maps API is a popular choice for developers who are creating applications in the mobile, social or local space that call for data embedded from a map. The folks at Google have organized the world’s information using human-generated data, creating a virtual representation of the physical world.
This API lets developers build innovative location-based apps for the web and mobile making it easier for users to better visualize geospatial data. Developers using this API can parse Google’s data and embed interactive maps, which helps them to create robust mapping applications.
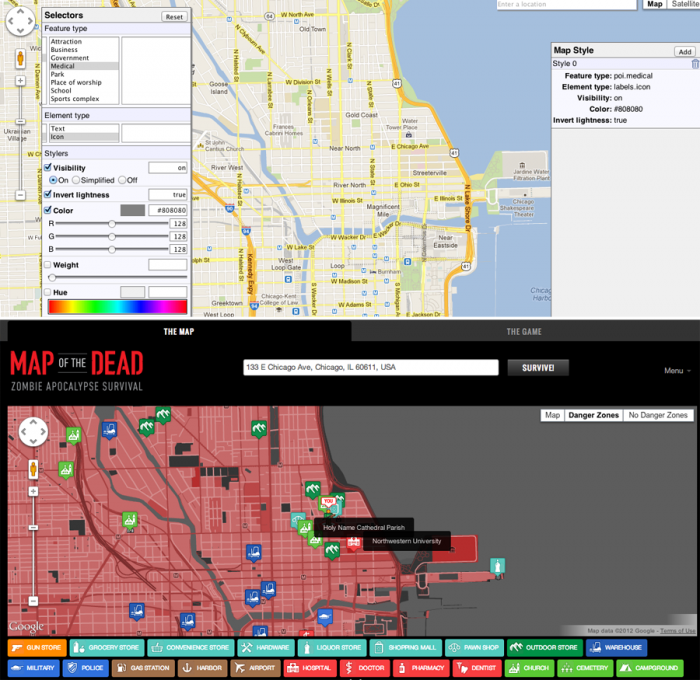
Google makes it easy for any third-party developer to integrate a customized version of Google Maps into websites and mobile applications. To create the Map of the Dead the Google Places API was used with the Google Maps API to plot location-based data of pre-set categories like hospitals and campgrounds.
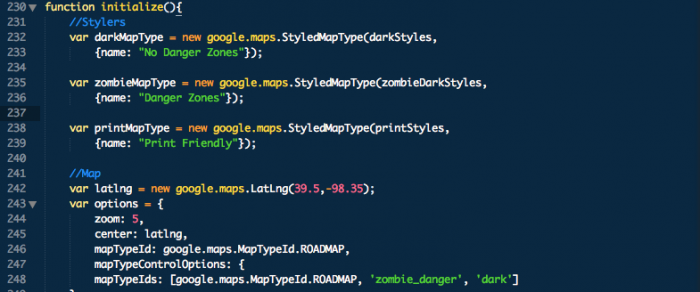
Dev’s can choose from a variety of basic map types: roadmap, satellite, hybrid or terrain. They can then customize these maps to highlight specific data or carry on the visual identity of the site they occupy.
To avoid the potentially time-consuming task of manually creating styles and testing code to see how your map will look, Google has created a Styled Map Wizard that allows you to customize the presentation of the standard Google base maps.
These customizations allow developers to simplify or soften the map in order to draw attention to the data provided. A great example of this implied visual focus can be seen in this regional map found on the New York Times website. Dev’s can change the visual display of elements such as roads, parks and build up areas to reflect a different style than that used in the default maps; they can even adjust width of line features such as roads and rivers. We used these customization features to create the ominous zombie-infested red and black landscape for the Map of the Dead.
To see more incredible maps made using the Google Maps API check out Google’s Geo Developers Blog which featured Doejo’s Map of the Dead earlier this year.