
We last looked at styling data in Mapbox Studio Classic. The new Mapbox Studio is now out of beta and lets you do many of the things you could do in Mapbox Studio Classic, but with a nice web-based GUI, no coding required. Some features haven’t made it over yet, you’ll recall in that previous post we styled some data by applying math to data values. This isn’t possible in the new Mapbox Studio, but is in progress.
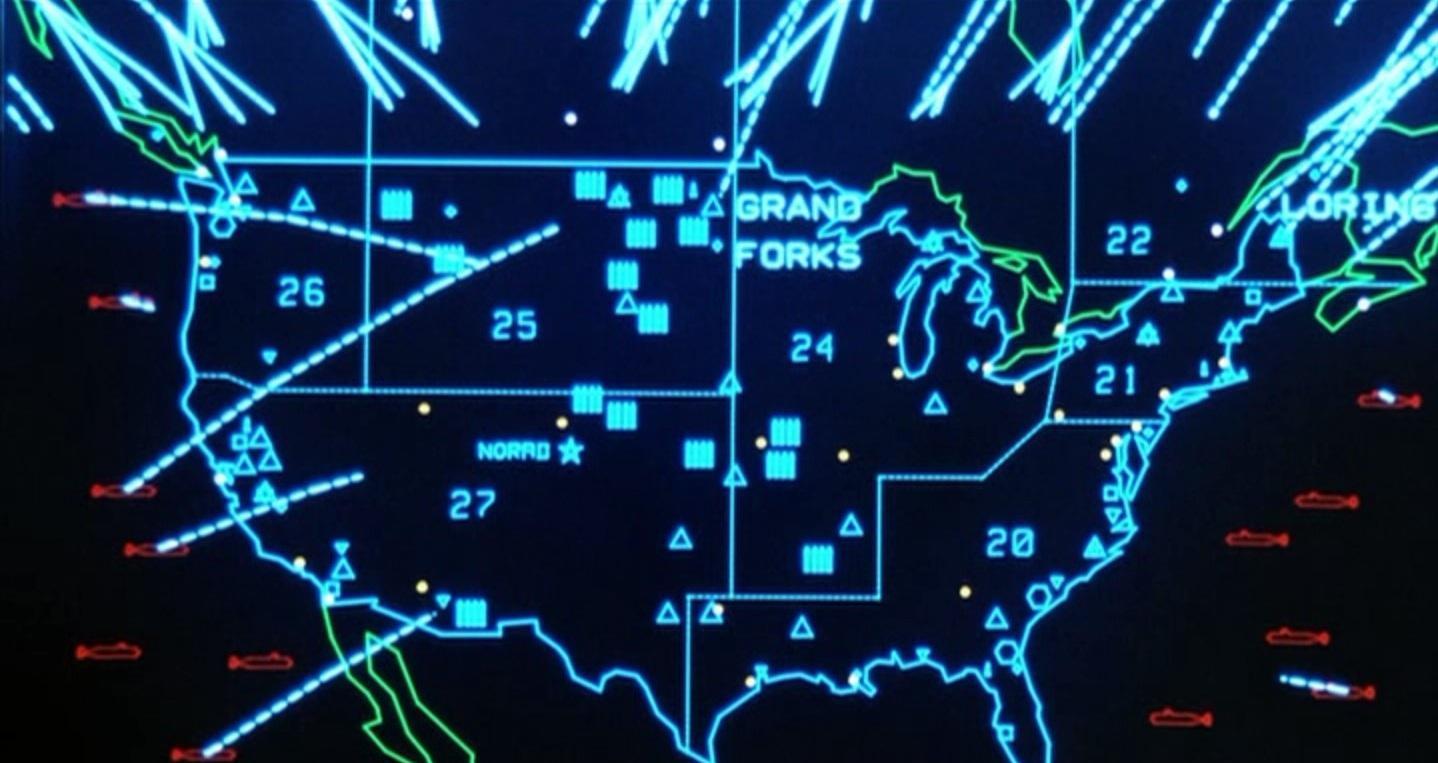
What follows is a general overview of some things I discovered when playing around with a new map style. I wanted to create an 80’s style military themed map, similar to what was in the 1983 movie WarGames (spoiler alert: Matthew Broderick almost starts WWIII) and the great 2006 game DEFCON.

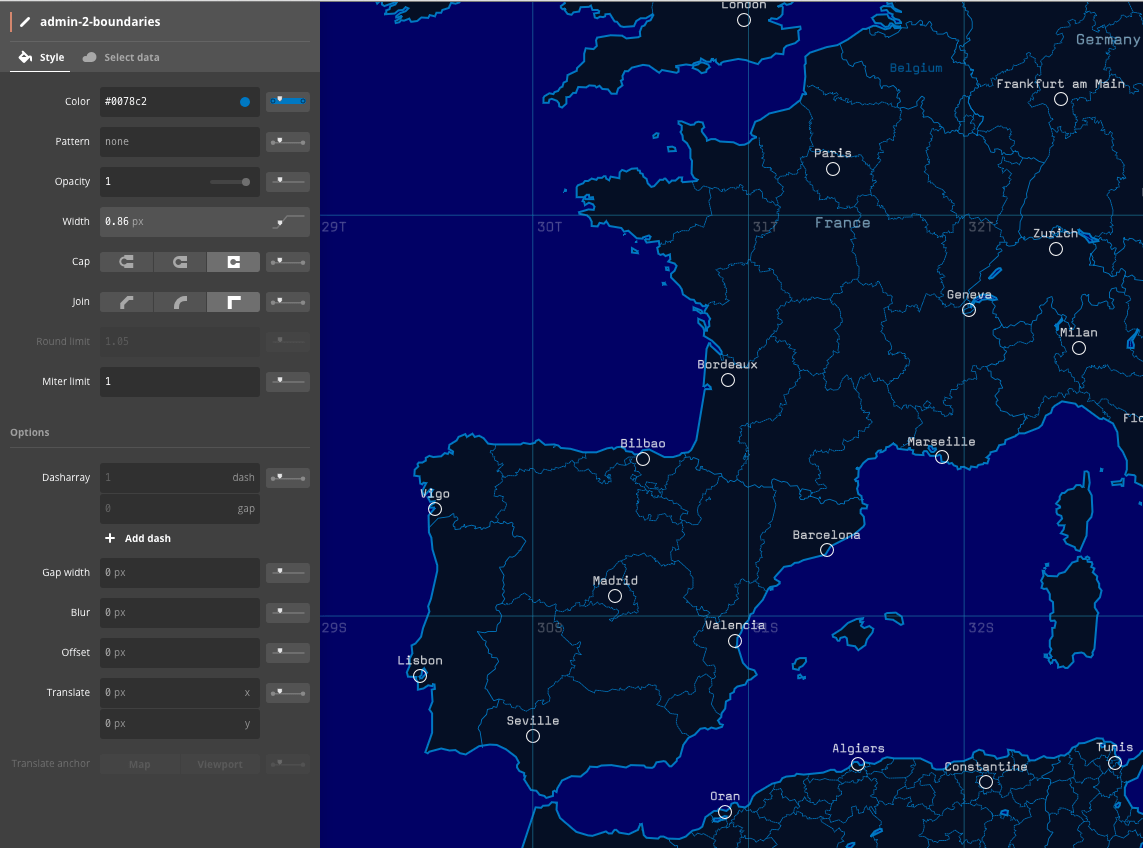
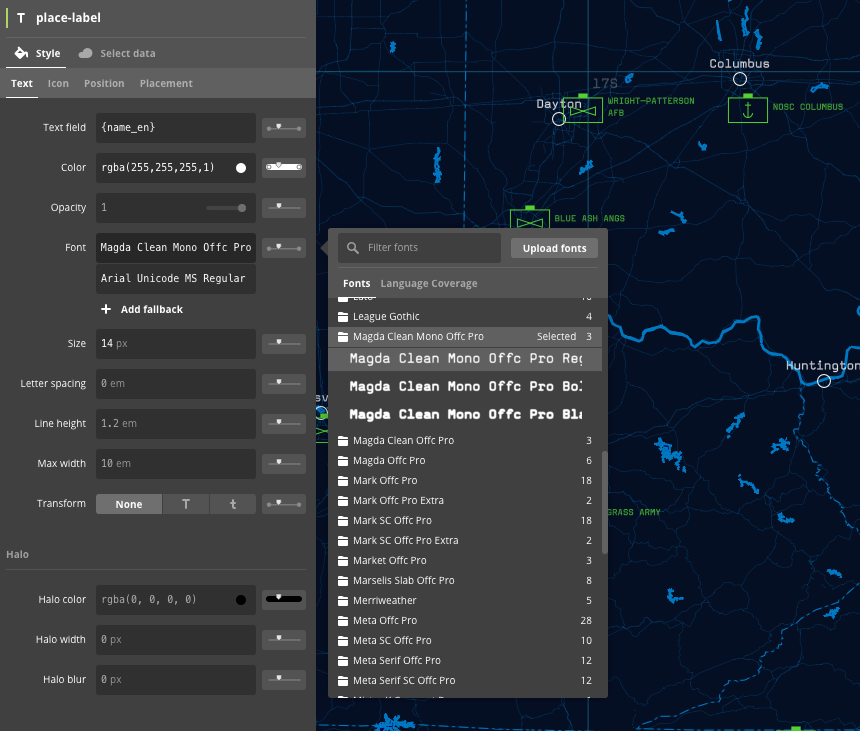
All the basic styling is pretty straightforward, you can style all the different map components as you’d expect and have a bunch of fonts to choose from for your labels.
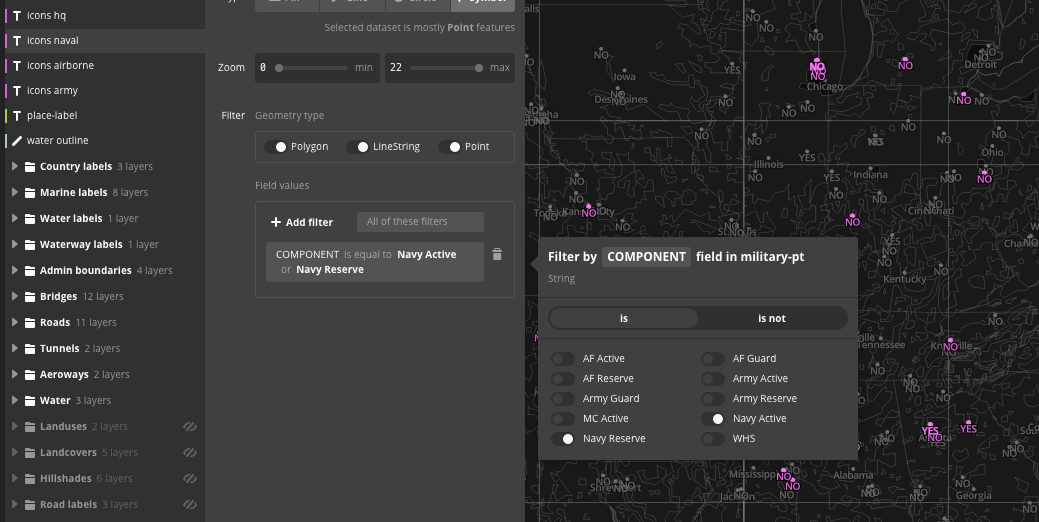
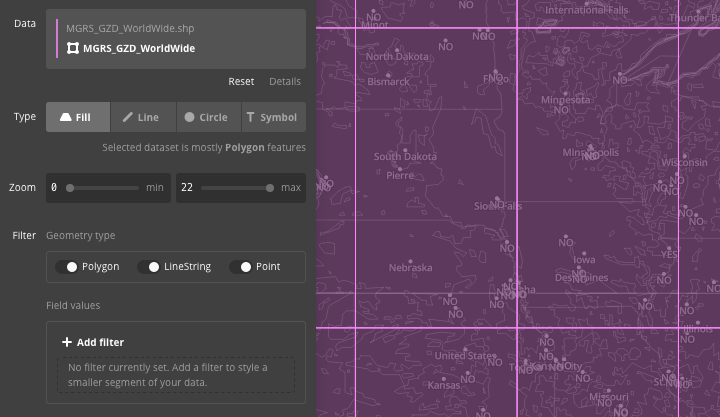
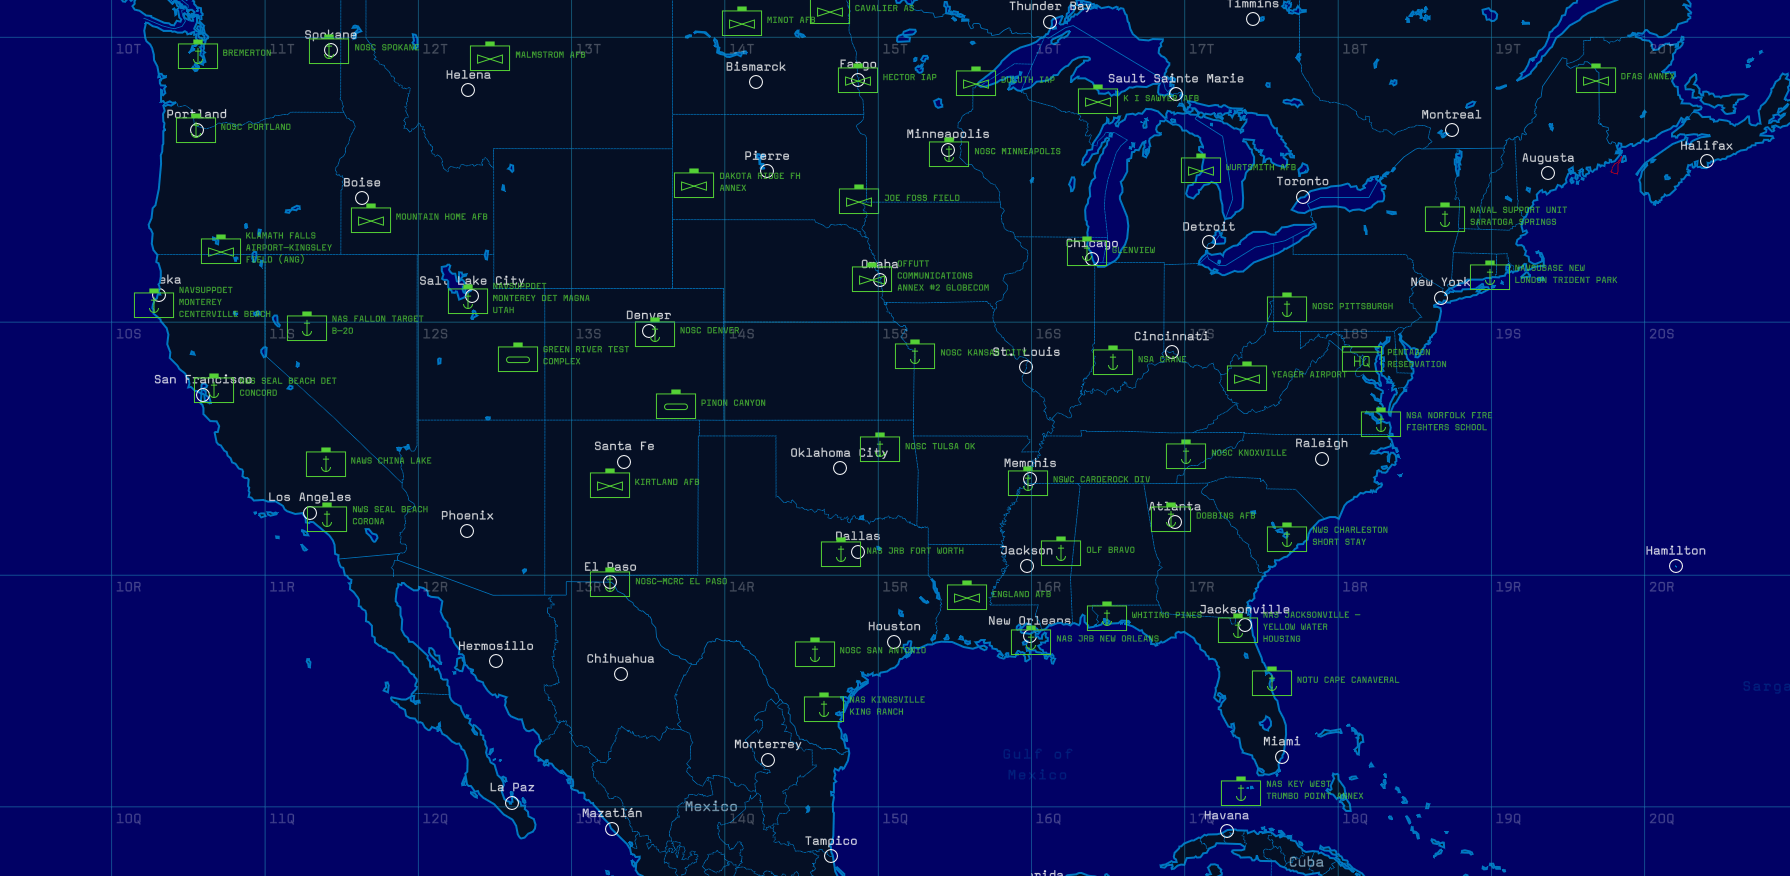
I found a shapefile containing data about all US military bases. You can see you can pretty easily filter based on different field values in the data.
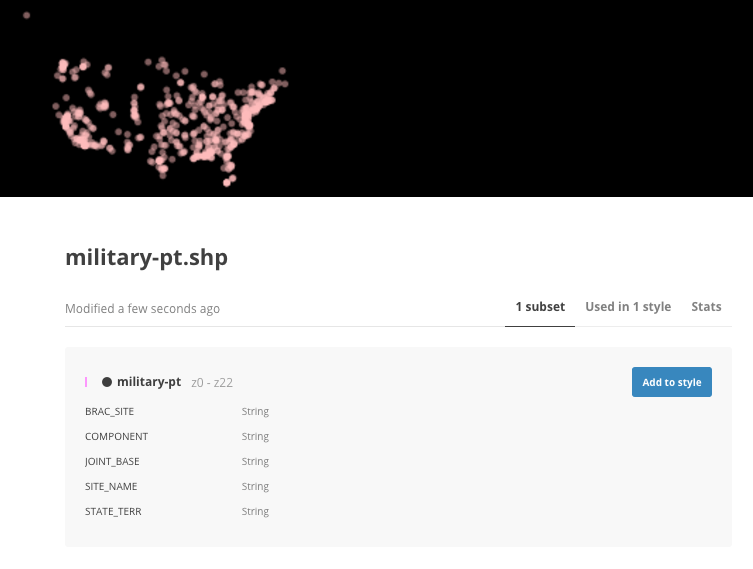
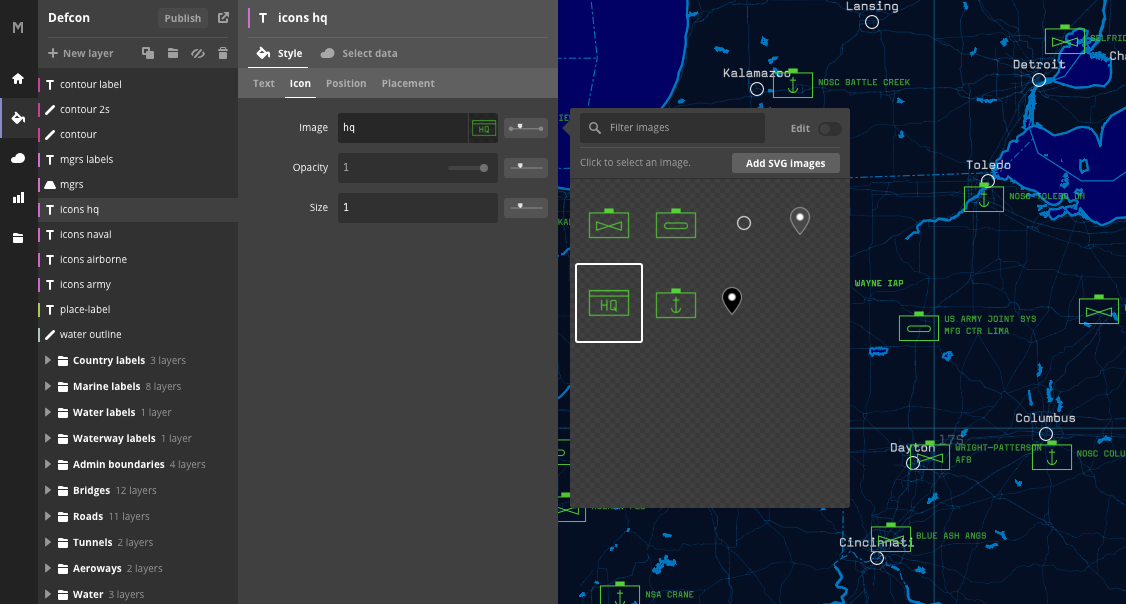
I used this to create different layers for each type of base. The cool thing is you can just upload SVGs to quickly have custom icons.
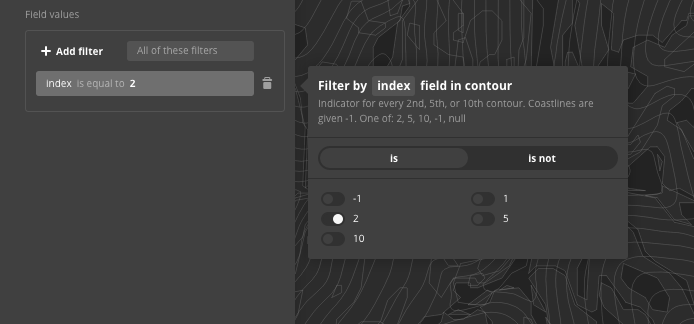
Why not add some contour lines too? The contour data has an index value, so you can easily change the style and add labels only to every other contour line.
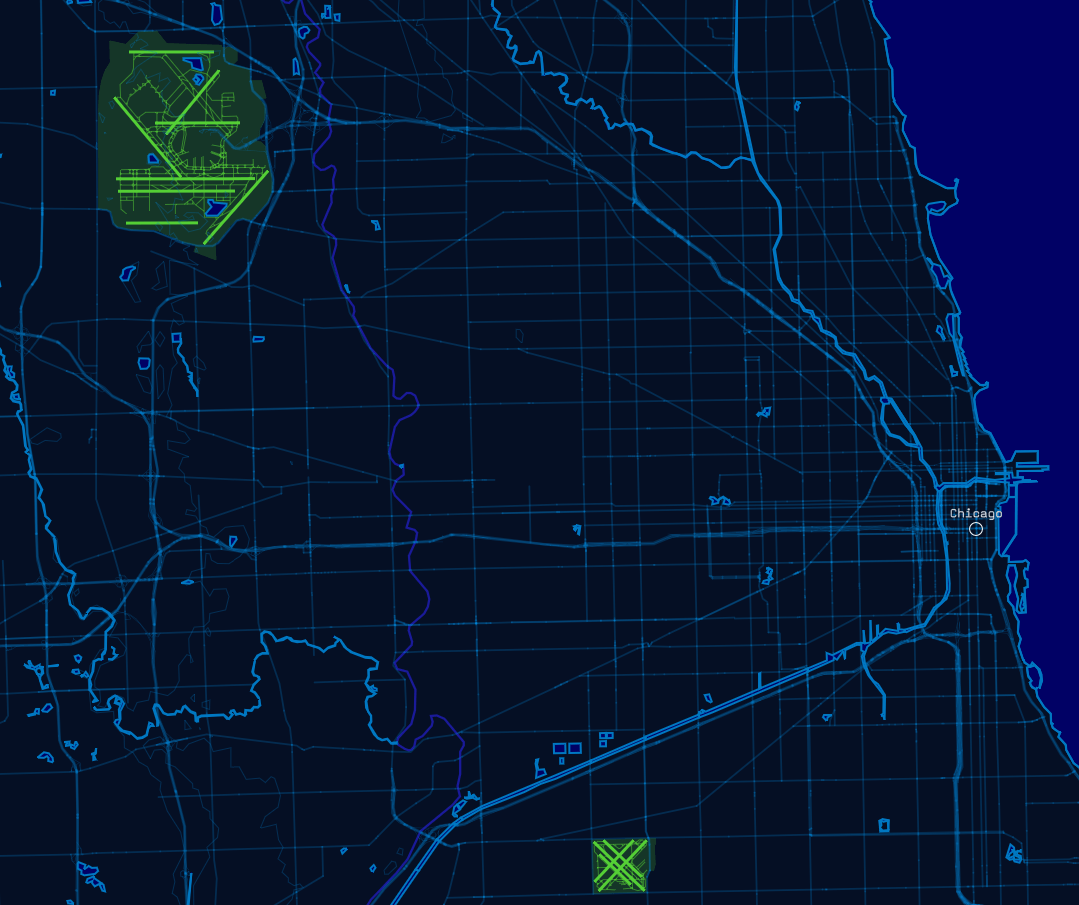
We can also highlight possibly strategic structures like airports with a couple clicks.
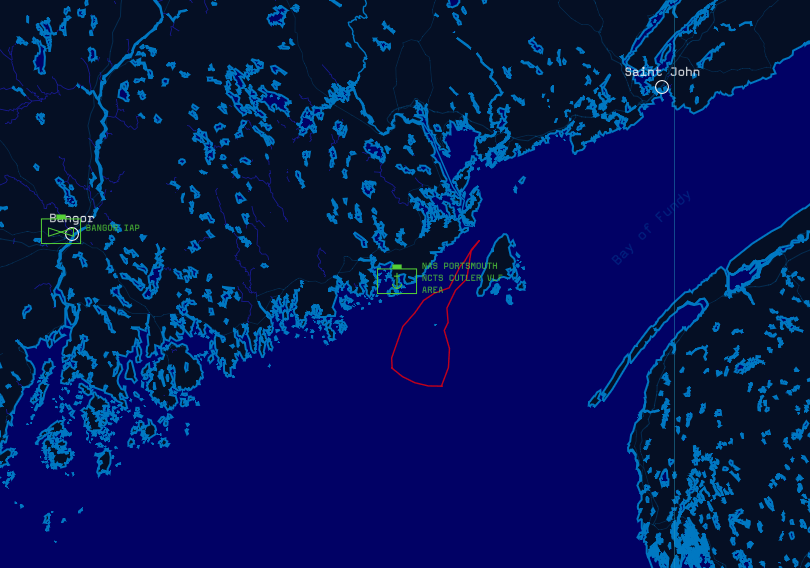
And highlight disputed borders in red. (Now you know Canada and the US have disputed borders)
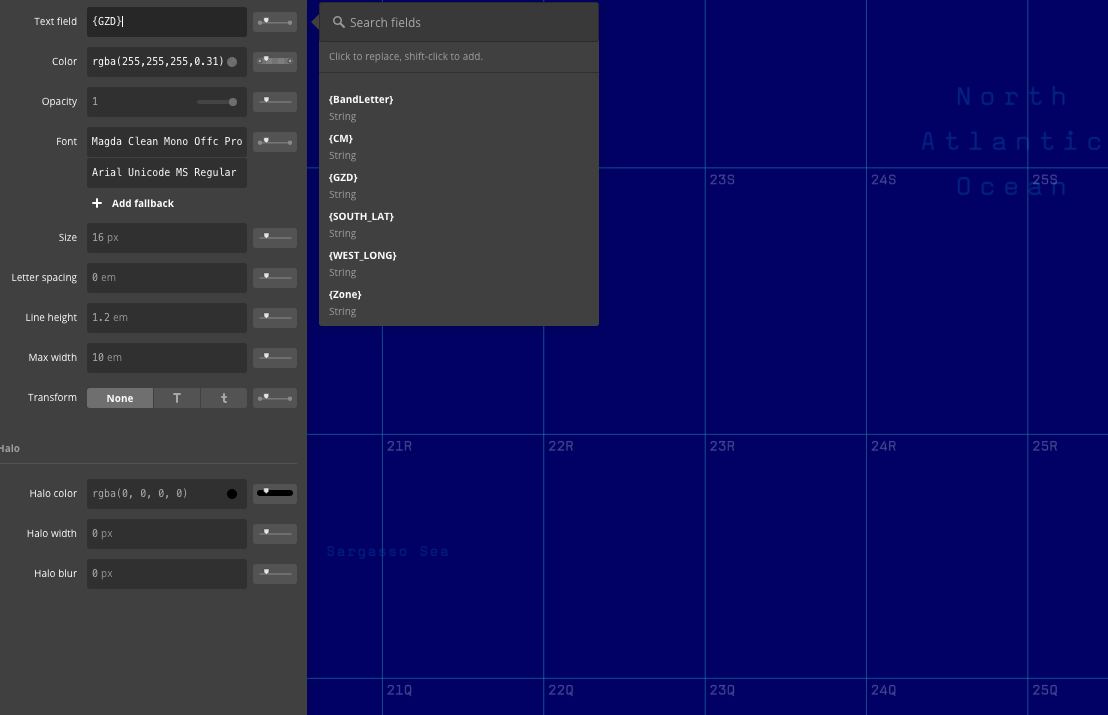
Also we can use a shapefile containing the Military Grid Reference System and get a neat looking grid over everything with accurate labels.
At the end you have a pretty cool map.
View the full interactive map here
You can see a bunch of examples of maps, including the Defcon map, in Mapbox’s gallery.